
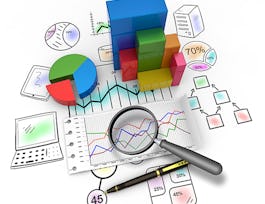
Whether being used to customize advertising to millions of website visitors or streamline inventory ordering at a small restaurant, data is becoming more integral to success. Too often, we’re not sure how use data to find answers to the questions that will make us more successful in what we do. In this course, you will discover what data is and think about what questions you have that can be answered by the data – even if you’ve never thought about data before. Based on existing data, you will learn to develop a research question, describe the variables and their relationships, calculate basic statistics, and present your results clearly. By the end of the course, you will be able to use powerful data analysis tools – either SAS or Python – to manage and visualize your data, including how to deal with missing data, variable groups, and graphs. Throughout the course, you will share your progress with others to gain valuable feedback, while also learning how your peers use data to answer their own questions.


Data Management and Visualization
This course is part of Data Analysis and Interpretation Specialization
Taught in English
Some content may not be translated

Instructor: Lisa Dierker
81,017 already enrolled
Included with 
Course
(931 reviews)
94%
Skills you'll gain
Details to know

Add to your LinkedIn profile
Course
(931 reviews)
94%
See how employees at top companies are mastering in-demand skills

Build your subject-matter expertise
- Learn new concepts from industry experts
- Gain a foundational understanding of a subject or tool
- Develop job-relevant skills with hands-on projects
- Earn a shareable career certificate


Earn a career certificate
Add this credential to your LinkedIn profile, resume, or CV
Share it on social media and in your performance review

There are 5 modules in this course
We would like to welcome you to Wesleyan University's Data Analysis and Interpretation Specialization. In this session, we will discuss the basics of data analysis. Your task will be to select a data set that you would like to work with and to review available code books that help you develop your own research question. You will also set up a Tumblr blog that will allow you to reflect on these experiences, submit assignments and share your work with others throughout the course. First, you may want to check out the welcome video
What's included
5 videos5 readings1 peer review
In this session, we will discuss how to write a basic program that allows you to load a data set and examine frequency distributions. Your task will be to write a program that helps you to explore the variables you have selected for your own research question. You may choose either Python or SAS. Both are made freely available, and we have created a helpful guide to support you in making the decision. Once you have selected your platform, just follow the instructions in the appropriate "GETTING STARTED...." file, and then check out this week's video lessons aimed at helping you write and run your first program. You need only view the lessons for one of the statistical platforms (SAS or Python).
What's included
8 videos8 readings1 peer review
In this session, we will help you to make and implement even more decisions with data. Statisticians often call this task 'data management', while computer scientists like the term 'data munging'. Whatever you call it, it is a vital and ongoing process when working with data. Your task will be to write a program that manages the variables you have selected for your own research question.
What's included
8 videos4 readings1 peer review
In this session we will discuss descriptive statistics and get you visualizing your newly data managed variables individually and as graphs showing the relationships between them.
What's included
12 videos5 readings1 peer review
What's included
3 readings
Instructor
Offered by


Recommended if you're interested in Data Analysis
Wesleyan University

University of California, Davis
Coursera Project Network
Why people choose Coursera for their career


Learner reviews
Showing 3 of 931
931 reviews
- 5 stars
64.08%
- 4 stars
24.19%
- 3 stars
6.02%
- 2 stars
1.82%
- 1 star
3.87%
New to Data Analysis? Start here.

Open new doors with Coursera Plus
Unlimited access to 7,000+ world-class courses, hands-on projects, and job-ready certificate programs - all included in your subscription
Advance your career with an online degree
Earn a degree from world-class universities - 100% online
Join over 3,400 global companies that choose Coursera for Business
Upskill your employees to excel in the digital economy
Frequently asked questions
Access to lectures and assignments depends on your type of enrollment. If you take a course in audit mode, you will be able to see most course materials for free. To access graded assignments and to earn a Certificate, you will need to purchase the Certificate experience, during or after your audit. If you don't see the audit option:
The course may not offer an audit option. You can try a Free Trial instead, or apply for Financial Aid.
The course may offer 'Full Course, No Certificate' instead. This option lets you see all course materials, submit required assessments, and get a final grade. This also means that you will not be able to purchase a Certificate experience.
When you enroll in the course, you get access to all of the courses in the Specialization, and you earn a certificate when you complete the work. Your electronic Certificate will be added to your Accomplishments page - from there, you can print your Certificate or add it to your LinkedIn profile. If you only want to read and view the course content, you can audit the course for free.
If you subscribed, you get a 7-day free trial during which you can cancel at no penalty. After that, we don’t give refunds, but you can cancel your subscription at any time. See our full refund policy.